UPDATED. It seems that Microsoft borrowed my idea of analyzing Azure Hybrid Benefit usage with Azure Monitor Workbooks and included the corresponding charts in the Cost Optimization workbook in Azure Advisor. Feel free to check it for AHUB numbers and recommendations in your environment. It’s great to see that they listen to customer feedback!
In one of my previous blog posts, I wrote about enabling Azure Hybrid Benefit at scale using Azure Policy. Today we are going to explore how you can keep track of actual license counts consumed by Azure services with that license benefit turned on. Moreover, we will try to analyze those resources for optimal benefit usage.
If you want to skip the details and just get the Workbook for auditing Azure Hybrid Benefit usage, check for its template in my GitHub repository.
What are Azure Workbooks?
Azure Workbooks (also known as Azure Monitor Workbooks) is an excellent tool for visualizing data in the Azure Portal and sharing prebuilt reports with other users. They allow you to pull data from different data sources, extract some meaningful insights from that data, and present them to users in various formats. If you are familiar with Azure Dashboards, you can think of Azure Workbooks as a more advanced reporting solution.
There is enough documentation to start working with Azure Workbooks, so I will focus more on the practical case rather than explaining Workbooks’ functionality. If you are not familiar with them, in addition to the official documentation, I recommend checking the following videos produced by the people who created that great Azure service:
- How to use Azure Monitor workbooks
- How to build Azure Workbooks using logs and parameters
- How to build a graph and use links in Azure Workbooks
- How to build tabs and alerts in Azure workbooks
Working with most supported Azure Workbook data sources requires using Kusto Query Language (KQL) to query data and JSON to parse API responses, so some knowledge of those technologies will be desirable too.
On a personal side, I must admit that I overlooked Azure Workbooks functionality for a long time because I could usually gather required data using PowerShell much faster. However, doing everything with a familiar tool only won’t help you explore other options, so you understand their pros and cons and can use them effectively. Therefore, I just decided to use this practical case as a learning opportunity for myself.
What data are we going to use, and how can we bring it to a Workbook?
For the sake of simplicity, let’s focus on Azure Hybrid Benefit for Windows Server VMs only. Technically, we need to get the list of all Azure VMs with Windows Server OS and Hybrid Benefit enabled. For that task, we can leverage the power of Azure Resource Graph. A sample Graph query might look like this:
That query looks up for all Azure resources where a resource type is Azure VM, the OS image publisher is Microsoft Windows Server, and the corresponding VM property controlling the license benefit usage is equal to ‘Windows_Server’.
Please note that KQL is case-sensitive, and I use case-insensitive operators as value naming is not always consistent across all Graph tables.
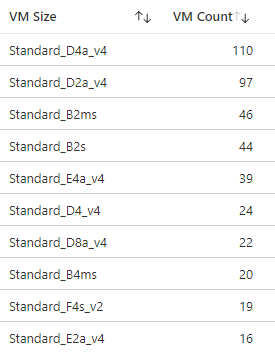
As Azure Hybrid Benefit for Windows Server VMs entitles you to cover the software costs based on the number of core licenses you own, we will summarize query findings as the counts of discovered VM sizes:
Unfortunately, Azure VM size names don’t always correctly reflect the number of vCPUs according to the Azure VM sizes naming convention. So, just parsing the VM size names for CPU counts won’t work. A suggested approach to get such data is to use the Resource SKUs API. As that API is a part of Azure Resource Manager REST APIs, we can use an Azure Resource Manager query in our workbook to pull the data from it:
/subscriptions/{Subscription:id}/providers/Microsoft.Compute/skus?api-version=2021-07-01&$filter=location eq '{Location}'
Note that the API is subscription-scoped, and we provide the subscription ID via a Workbook parameter. Apart from that, we are scoping the data to a particular Azure region, which is also a parameter, to limit the amount of data the query returns and to avoid duplicates.
Theoretically, if your Azure VMs are deployed across many different regions, you might miss data about VM sizes unavailable in the region scoped by the query. However, in practice, the VMs are usually deployed to a limited number of customer-selected Azure regions that support the same set of required VM SKUs. If that is not the case, you might need to pull the list of supported VM sizes for all regions and remove duplicate data from the results.
As the mentioned API returns a JSON payload containing SKU data for different resource types, we can transform the result with JSONPath expressions:
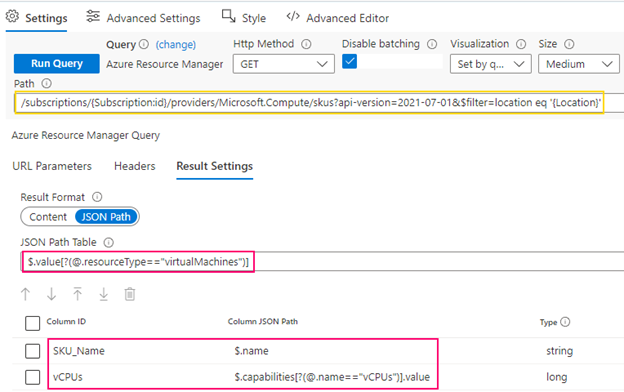
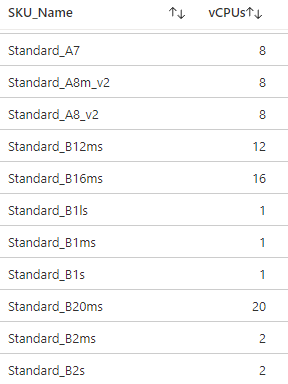
Firstly, we filter items where the resource type is Azure VM. Secondly, we select only the VM size properties we are interested in: a VM SKU name and the number of vCPUs. A sample query output might look like the following table:
Can we combine data from different data sources?
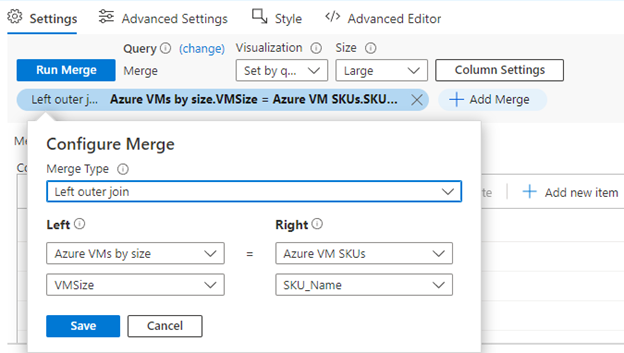
Now we have two pieces of data – the counts of used Azure VM sizes with Azure Hybrid Benefit enabled and the number of vCPUs for each VM size. It would be great if we could combine that data like joining tables in SQL. Fortunately, we can do that using Azure Workbook Merge functionality. It allows you to perform different types of joins, so here we will use the left outer join to combine all items from our Azure VMs grouped by size (right table) with the matching items from the Azure VM SKUs list (left table):
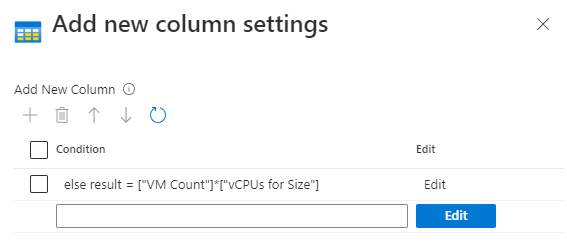
Also, we can select what columns we want to see in the resulting data set and remove duplicate ones. Additionally, the Merge data source allows you to extend your data set using calculated columns. For example, you can use expressions to calculate the total number of used vCPUs per VM size:
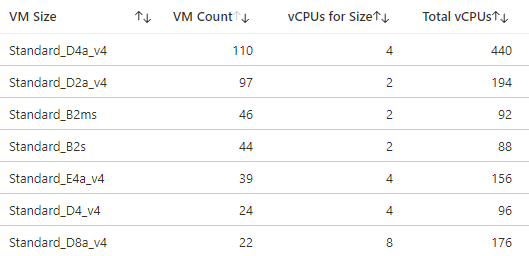
The resulting table might look like the following:
However, those results are intermediate only, as the number of CPU cores doesn’t directly translate to the number of core licenses you need to have. So, how do we know how many core licenses are consumed by each VM size?
Do you really benefit from Azure Hybrid Benefit?
As it turns out, regardless of the number of vCPUs, each Windows Server Azure VM with less than 8 vCPUs always consumes 8 core licenses. Servers with more than 8 vCPUs can stack more licenses on top of that minimum, but the license count should be rounded up to the nearest bigger integer divisible by 8. So, a 12-CPU VM will still consume 16 core licenses and so on.
In order to determine the actual number of required core licenses for our Windows Server VM fleet, we can use an additional calculated column with the next conditional logic:
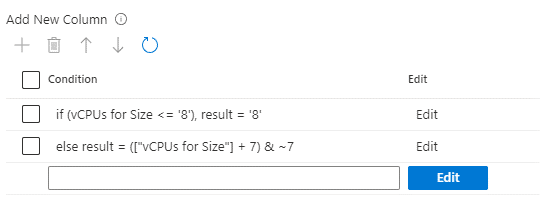
Those expressions round up the number of licenses to:
- 8 if an Azure VM has less than 8 vCPUs,
- the nearest bigger integer divisible by 8 in all other cases.
So, now we can see exactly how many core licenses are needed for each Azure VM size group without doing any math manually.
On top of that, we can do another trick with calculated columns and add icons signaling if a specific VM size is using Azure Hybrid Benefit efficiently from the license point of view:
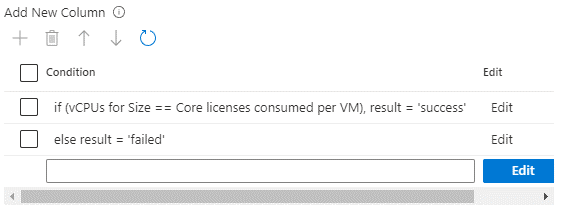
The condition here compares the number of licenses required to the number of vCPUs and produces success output if those numbers are equal. All other cases are considered suboptimal.
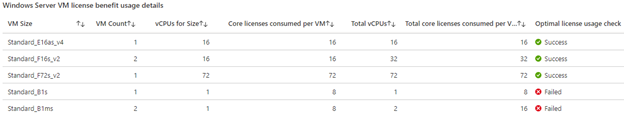
That visualization can help us quickly understand what VM sizes in use don’t get the full advantage of the license benefit. That can be especially helpful if you don’t have enough core licenses to cover all your Azure VMs, and it makes sense to redistribute them for maximum savings – enable Azure Hybrid Benefit only for VMs with 8 vCPUs and more.
Can we make our solution more user-friendly and reusable?
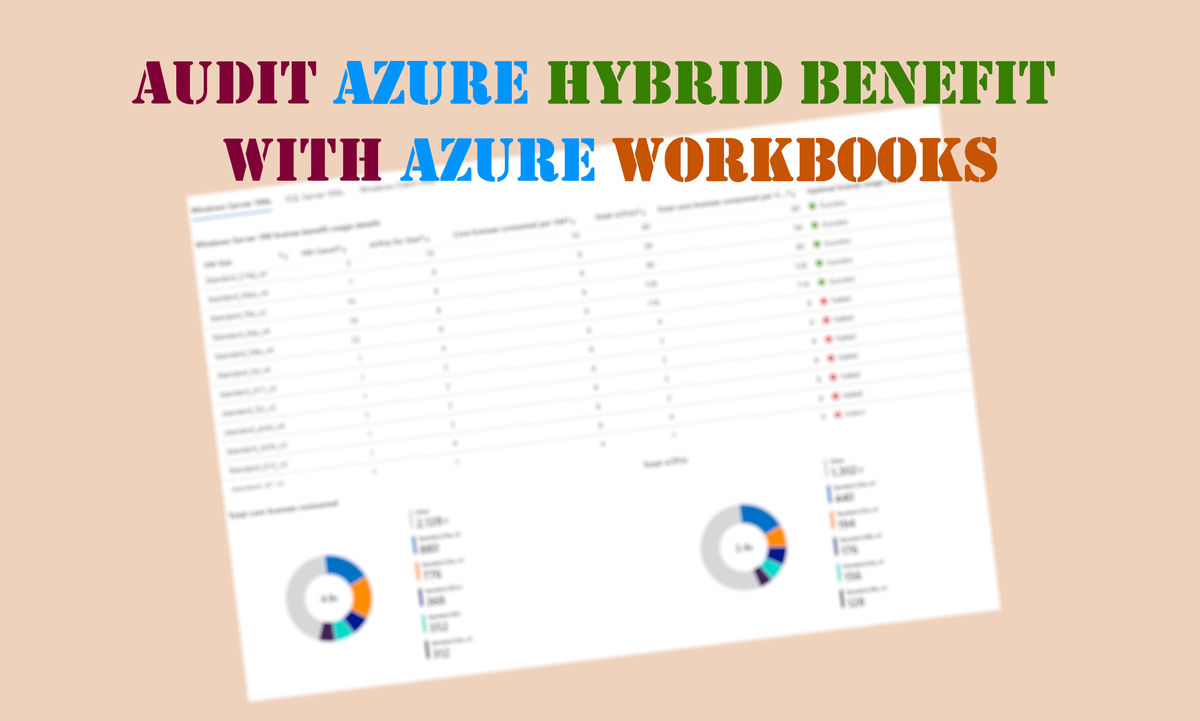
At this point, our resulting table contains all details we might need for auditing Azure Hybrid Benefit usage by Windows Server VMs in a subscription. However, what if we want to have some top-level indicators based on that data to provide us with quick insights without digging into the records? For example, let’s add the total number of consumed core licenses and the total number of vCPUs so that we can see how effectively we use licenses in general.
Instead of running additional queries in our workbook to fetch that data, we can reuse the existing dataset using the Merge data source. It allows you to make a copy of another query results so that you can present them in a different format:
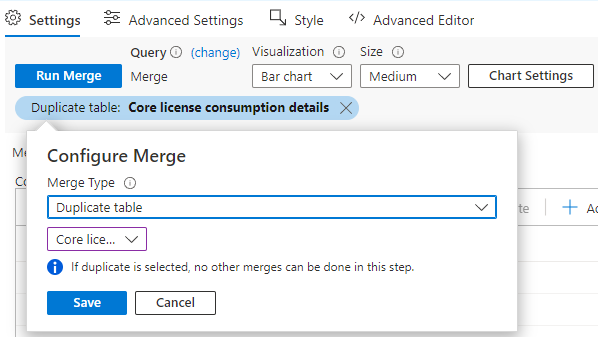
Then we can remove unnecessary columns, choose a different visualization option, and select the category to focus on:
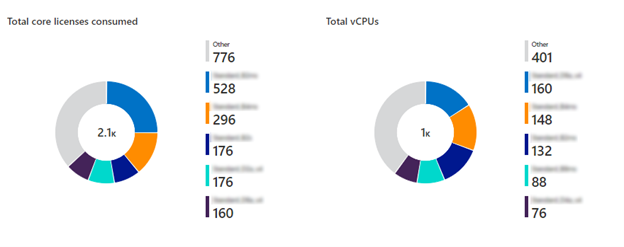
As you can see from the sample figures above, the usage of licenses in a lab environment is far from being efficient.
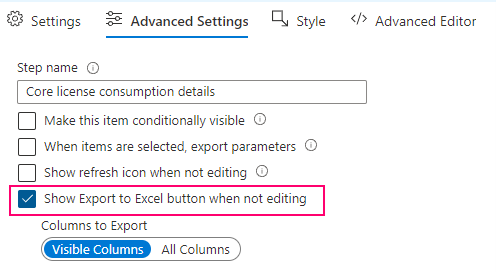
Apart from those improvements, we can easily enable data export in Azure Workbooks, so other non-technical people can export the detailed results if they want to do some analysis with external tools:
Azure Workbooks can be exported as Workbook templates or ARM templates. Those templates can be imported into other environments(subscriptions) without any substantial preparation. That allows you to share them with other people as ready-to-consume solutions that don’t require technical expertise to use them, making it a perfect case for solution adoption.
What is next?
Finally, you can grab the ready-to-use Workbook for auditing Azure Hybrid Benefit usage from my GitHub repository, import it into your Azure subscription, and check the license numbers in your environment. Currently, it covers the cases for Azure Hybrid Benefit for Windows Server VMs, SQL Server VMs, and Windows Client VMs (aka Multitenant Hosting Rights). Feel free to adjust it to your needs and add missing functionality for other Azure Hybrid Benefit use cases.
Got a question? Post it in the comments below and let me know if that guide was helpful for you 👇
Update. The workbook was also updated to provide information about the license benefit usage by Azure SQL Database and SQL Managed Instance.

Member discussion: